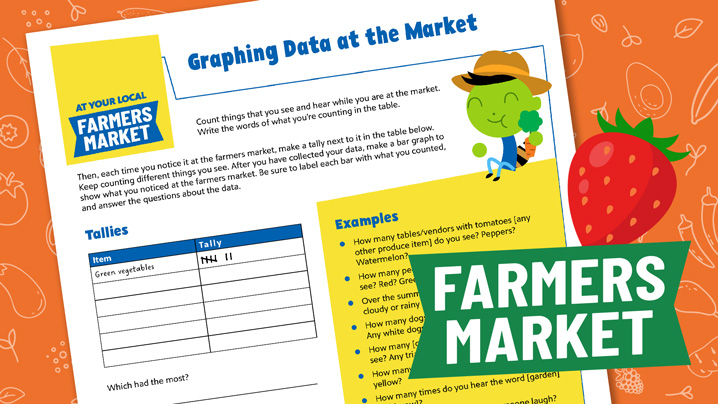
Graphing Data at the Farmers Market Count things you see and hear while you are at the market, then create a bar graph to illustrate the data you collected. Available in English and Spanish. Document STEM Download Activity