Insects can range in scale from nuisance to crop killing. The fight to reduce the spread of either takes on different strategies - including the use of data from around the globe.


Insects can range in scale from nuisance to crop killing.
The fight to reduce the spread of either takes on different strategies - including the use of data from around the globe.
Colleen Bradford Krantz explains in our Cover Story.
Transcript
This locust infestation in East Africa was already unusually large in 2019. Weather conditions continued to be ideal for the short-horned grasshoppers and their numbers grew exponentially the following year, before shrinking in 2021.
Keith Cressman, United Nations Food and Agriculture Organization: “There are swarms that are - it’s not uncommon to be, let’s say the size of Manhattan in New York City. So they can be very big. In one day, that swarm can eat the same amount of food as everybody in New York and California combined.”
It’s this kind of infestation – if it were to occur on U.S. soil - that Plant Protection and Quarantine, a unit within the U.S. Department of Agriculture, would be charged with monitoring and managing. This team of experts have spent the last few years improving their data-analysis and mapping tools. The hope is to more precisely pinpoint problem populations of crop-damaging insects, as well as plant diseases, before they get out of hand.
Matt Royer, Deputy Administrator, Plant Protection and Quarantine: “Most organizations these days are interested in creating dashboards and ways of viewing data so you can look at, you know, pie charts, you can look at pictures, storyboards, anytime information and share them. And the technology has matured to the point where we can make this more readily available.”
The Plant Protection and Quarantine dashboards are helping federal officials, who are working in tandem with state plant health experts, to decide where a limited amount of money should be spent to stop insect or bacterial disease threats to row crops.
The moment a local official counts insect populations and enters the numbers into a database, it instantly becomes part of a larger pool of information.
Matt Royer, Deputy Administrator, Plant Protection and Quarantine: “If you go back two years, we would have had pencil on paper more. We are going toward electronic data collection. You could imagine when you have pencil and paper and are transcribing to computer, there’s opportunity to err. And I think one-time collection helps reduce that.”
Royer’s team says the dashboard interface can help with locating concentrations of various pests and diseases, as well as being used to pinpoint activity in a specific geographic location.
Derek Witt, Plant Protection and Quarantine: “So what we’re looking at here on this dashboard for the grasshopper and Mormon cricket program is obviously a wealth of different metrics related to treatments and surveys, but then the mapping component really adds another dimension of ability to dig into the data.”
The maps generated from the database can also be used to evaluate the effectiveness of the previous year’s pesticide treatments as one official explained earlier this year.
Derek Witt, Plant Protection and Quarantine: “We can zoom over to Wyoming and see that for the areas we treated last year. Whereas last year this area was just peppered with reds and oranges, we were able to get in here and it looks like, for the most part, the treatments were successful because we now have dark blues, blues.”
Just like long-term weather forecasts, Plant Protection and Quarantine officials can predict which areas might have the most trouble with a particular pest or plant disease in the coming months and years.
Derek Witt, Plant Protection and Quarantine: “Generally how it works is we have our state plant health directors…submit requests for treatment, knowing or having a pretty good guess that we are going to have a very high density or destructive grasshopper year…As you can see, we’ve already dug way down into the data just to see this stuff in Eastern Montana…up here on the Flathead Indian Reservation and over in other parts of Eastern Montana, we had high nymphs grasshopper populations, which are areas you want to treat because nymphs obviously grow into adults and then the cycle goes forward.”
Eastern Montana ranchers, can attest to the accuracy of the dashboard data, especially where it applies to grasshoppers. They were bad in 2020 but even worse this summer, as this National Weather Service radar view of a swarm of grasshoppers shows.
Jason Pluhar, Pluhar Ranch Co., Cohagen, Montana: “We had the most grasshoppers I’ve ever seen, since I’ve been around. But I’m only 30 years old. My grandfather is 76 and said it was either the most amount of grasshoppers he’s ever seen or there might have been one other time in the ‘60s when he’s seen this many. But it was the most we’ve had in a long time, I know that.”
In summer 2020, the federal government added an additional $2.8 million to the original $2.6 million for grasshopper and Mormon cricket management in Montana and seven other states. The problem grew in some areas as drought conditions continued this year.
Jason Pluhar, Pluhar Ranch Co., Cohagen, Montana: “I’d walk out my front door and through my yard and I bet I had billions in my yard. You just couldn’t cover, without stepping on 20 every step. It was just ridiculous how many there were…Out in the pasture, the wheat was bad for part of the year and then as it kind of matured, they went back onto the alfalfa field and destroyed them.”
The Pluhars, who raise cattle, wheat, barley, corn, and hay, estimate they lost nearly 40 percent of their hay crop in 2020 due to the double punch of a dry season and grasshopper damage, but lost 87 percent this year. Pluhar likes the idea of the government improving the speed and accuracy of pest population tracking and predictions.
Jason Pluhar, Pluhar Ranch Co., Cohagen, Montana: “I think it would help. If you could track them and kind of know where they are going to hit, people can plan ahead and maybe plant more hay crops if they have livestock or be prepared to spray more…Anything to help prepare, you know?”
While the dashboards are, for now, primarily intended to be internal tools for government officials, PPQ has made some data available to the public.
Matt Royer, Deputy Administrator, APHIS’ PPQ: “The whole effort is trying to be more efficient at collecting data, managing data and sharing it.”
Reporting for Market to Market: Colleen Bradford Krantz, [email protected]
Watch More
The window to sell old crop is looking good right now and there’s a big event happening July 19 as Naomi Blohm talks about in Market Plus.
A big sell-off in cattle with several grains and the significance of the 100 day moving averages for corn, wheat and soybeans with Naomi Blohm in our Market Analysis.
Heat domes, wildfires and random rains blanket the Grain Belt. Who will care for the herd? A look at the rural veterinarian shortage. And, commodity market analysis with Naomi Blohm.
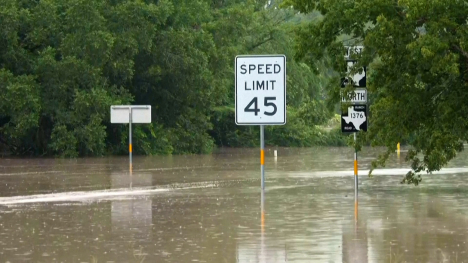
The Texas Hill Country saw flooding this week which led to two deaths and dozens of roads closed.
A growing shortage of veterinarians is leaving animal health care in rural America at risk.

Hard data backs up what American farmers have long been concerned about with Brazil. A squid squabble off the Oregon coast. And, commodity market analysis with Ted Seifried.